Experiment with the atmosphere.
A real weather model in your browser, for Europe and North America. Start from a real weather map, move a low or build a high, and see what happens over the next ten days.
Open Model LabFree. No account, nothing to install. Works best in Chrome or Edge on a computer.
Your browser cannot run the model (no WebGPU). Open this page on a computer with a recent Chrome or Edge.
Start from a famous situation.
Real weather maps from the day itself. Play them as the model sees them, or step in and see if it could have gone differently.
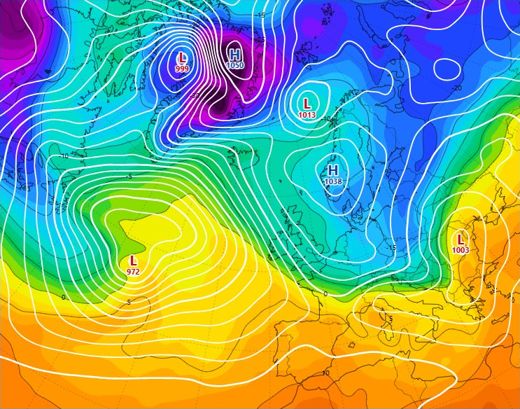
February 2021
Winter in the Benelux · 11 Feb 12 UTCSnow and hard frost. Can you make the winter last longer?
Start this situation ›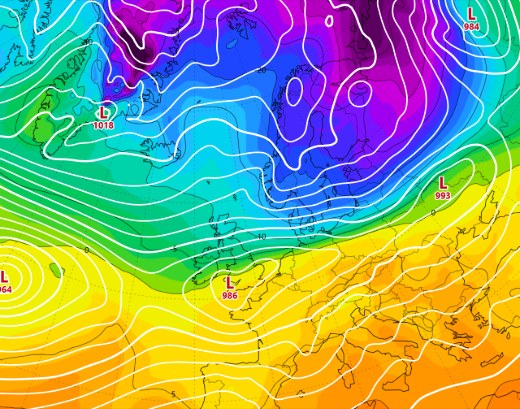
 31 December 1978
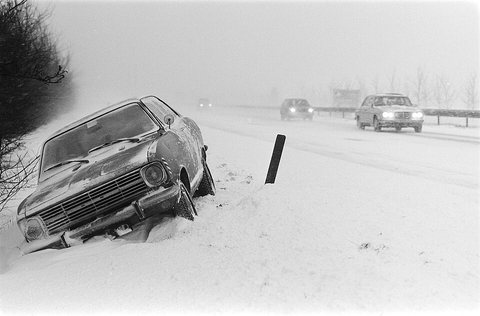
Blizzard, New Year 1978
Blizzard in the northern Netherlands · 29 Dec 12 UTCArctic air clashes with mild air over the Netherlands, with a blizzard in the north. Can you move the boundary?
Start this situation ›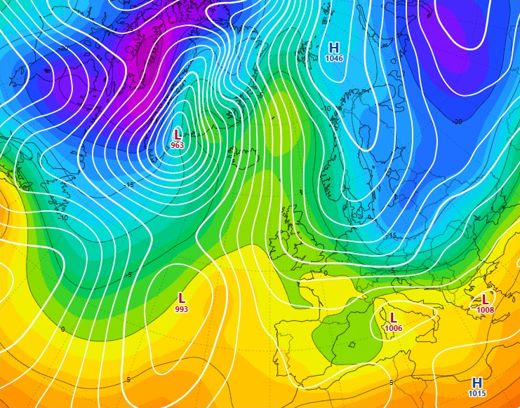
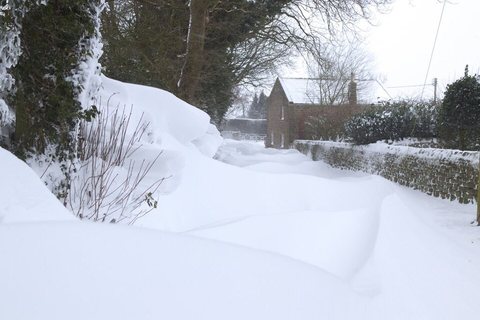 1 March 2018
Beast from the East, 2018
Siberian easterlies · 24 Feb 12 UTCThe Scandinavian high is building and the cold is waiting over Russia. Strengthen the high, or make Britain miss the cold?
Start this situation ›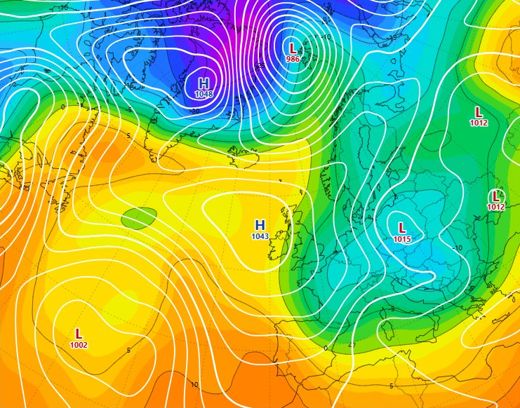
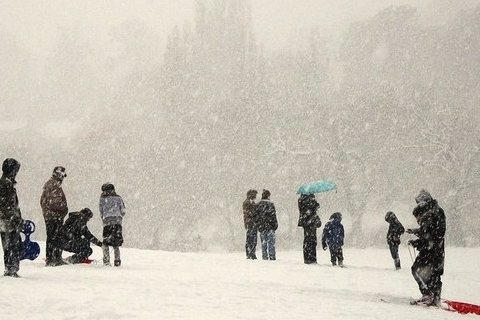 18 December 2010
December 2010
Snow and hard frost · 15 Dec 00 UTCBritain's coldest December in over a century, with snow across almost all of Europe. Can you hold the snow back?
Start this situation ›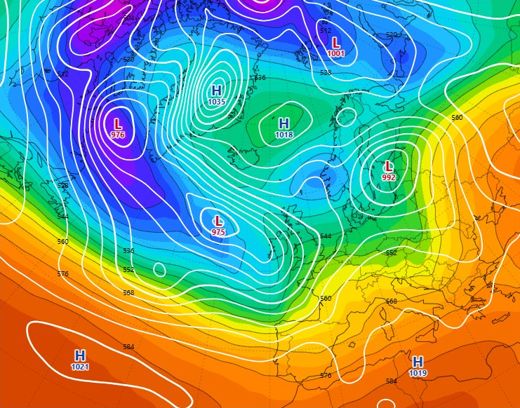
Storm Ciarán, November 2023
Deep autumn storm · 1 Nov 00 UTCCiarán is still far out over the Atlantic. Steer it north, or make it even deeper?
Start this situation ›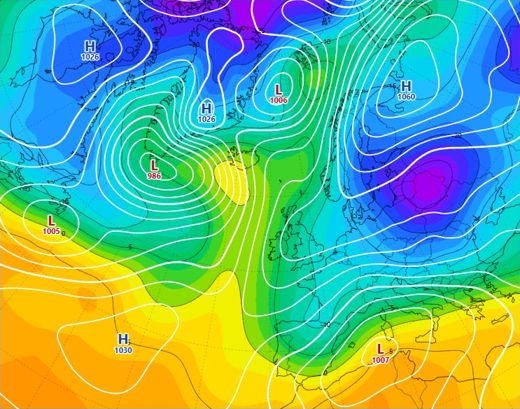
February 2012
Cold wave · 2 Feb 12 UTCBitter cold over Russia. Can you steer it towards the Benelux?
Start this situation ›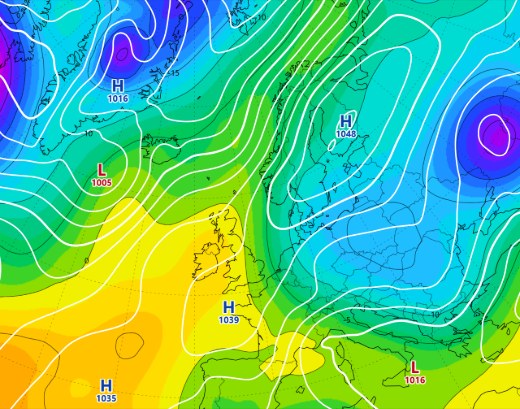
 11 February 2012
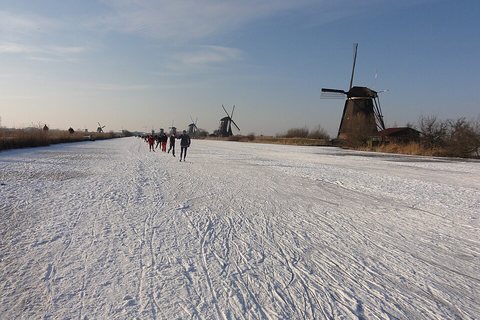
Elfstedentocht fever, February 2012
Hard frost, thaw on the way · 9 Feb 12 UTCBitter cold, and the whole of the Netherlands hopes for the first Elfstedentocht, the legendary 200 km race on natural ice, since 1997. But the thaw comes too soon. Can you hold on to the cold?
Start this situation ›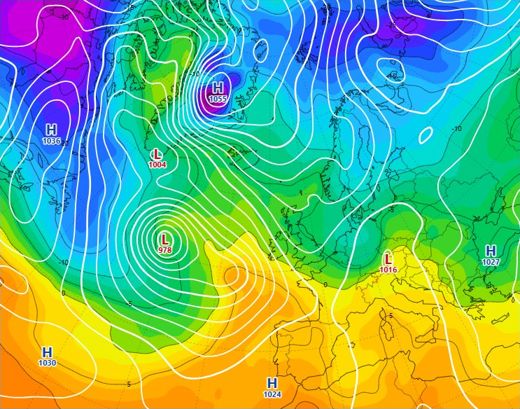
February 2025
Near-miss cold spell · 13 Feb 12 UTCThe worst of the cold just missed the Benelux. Would a small nudge do it?
Start this situation ›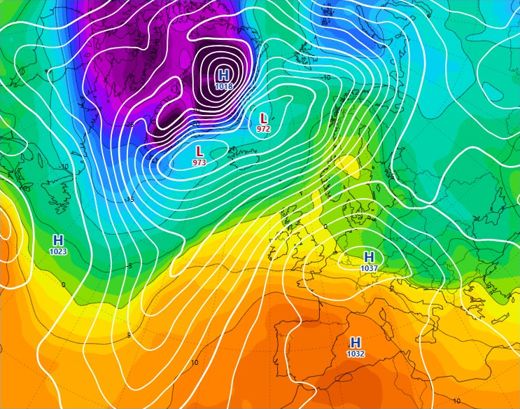
January 2024
Strong westerlies · 27 Jan 12 UTCMild westerlies across the whole Atlantic. Can you break them?
Start this situation ›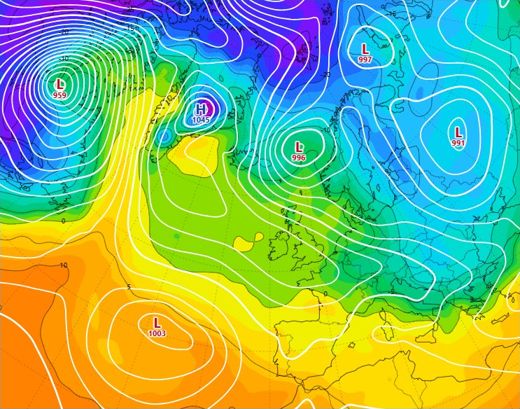
New Year's Eve 2025
Cold spell · 31 Dec 12 UTCCold air pours in around New Year. How long will it hold?
Start this situation ›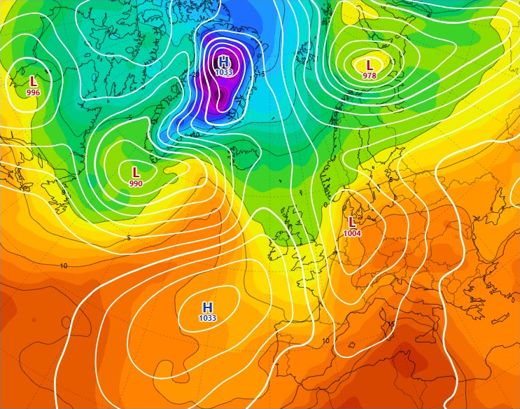
Today
The latest weather mapStart from today's weather and put the GFS forecast next to it.
Start from now ›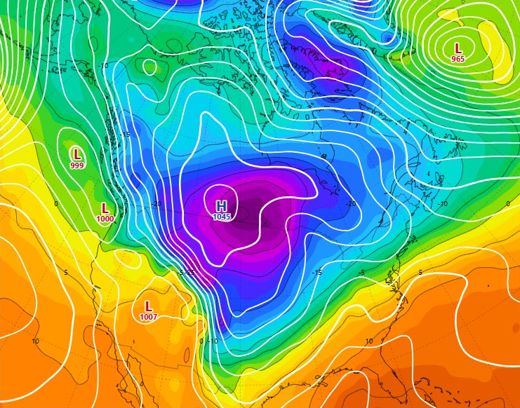
Texas freeze, February 2021
Arctic air into Texas · Feb 13, 12 UTCTwo days before the worst of the freeze. Make it even colder, or steer it away?
Start this situation ›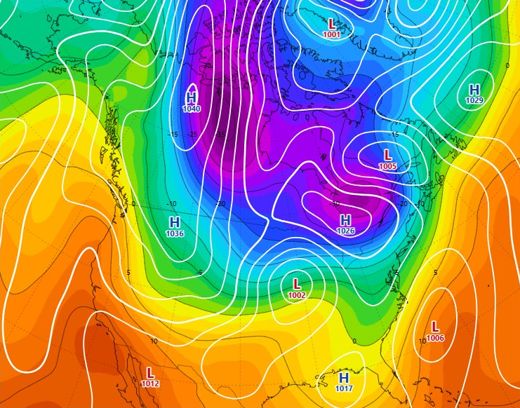
Polar vortex, January 2019
Extreme cold in the Midwest · Jan 28, 12 UTCChicago below -13 °F. How far south does the cold get?
Start this situation ›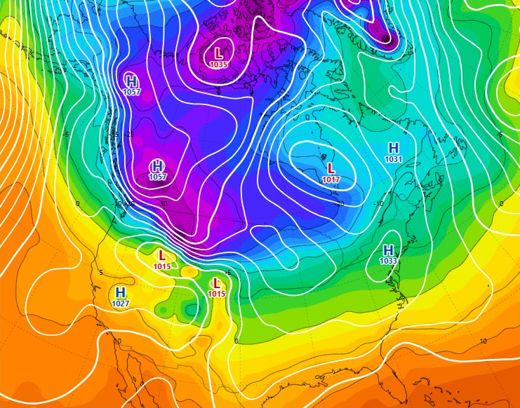
Winter Storm Elliott, December 2022
Christmas storm with bitter cold · Dec 21, 12 UTCAn explosive storm near the Great Lakes. Can you weaken it?
Start this situation ›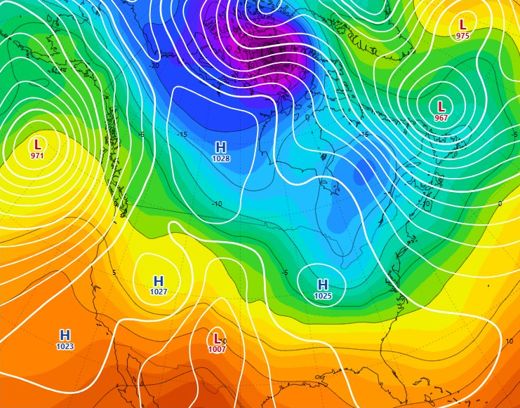
Blizzard Jonas, January 2016
Snow on the East Coast · Jan 21, 00 UTCWashington and New York buried in snow. What if the storm had stayed further out to sea?
Start this situation ›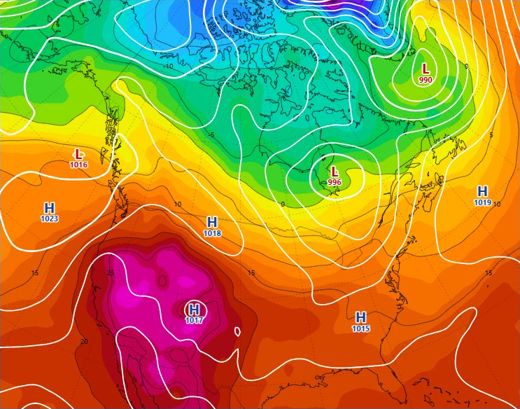
Today
The latest weather map, over North AmericaStart from today's weather and put the GFS forecast next to it.
Start from now ›Push up a ridge, pull down a trough.
Shape the 500 hPa map, the surface pressure or the temperature at one and a half kilometres. The model adjusts wind and temperature to your change and runs on.
Grab a low and drag it away.
What if that storm had passed a hundred kilometres further south? Drag it there and press play.
See what your change did.
Next to your version, the original runs along without your change. Or put the real GFS forecast next to it. Switch between the 500 hPa map, the temperature at 850 hPa and the sea surface.
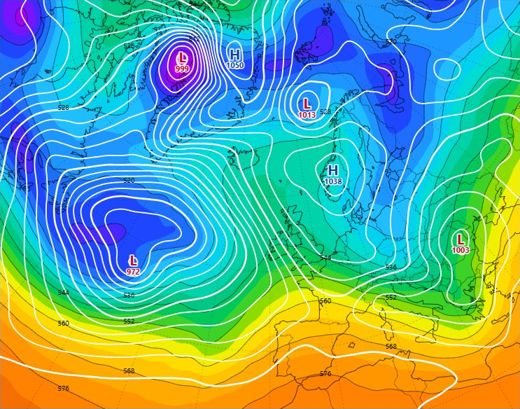
Cool the ocean down, or warm it up.
The ocean is Western Europe's central heating. Slide the Atlantic and the European seas up to 15 degrees colder or 5 degrees warmer, and see what is left of the mild westerlies after ten days.
In this example (February 2021, Atlantic 10 degrees colder) the air at one and a half kilometres is about 5 degrees colder over Ireland and Britain after ten days, and 4 degrees over the Benelux.
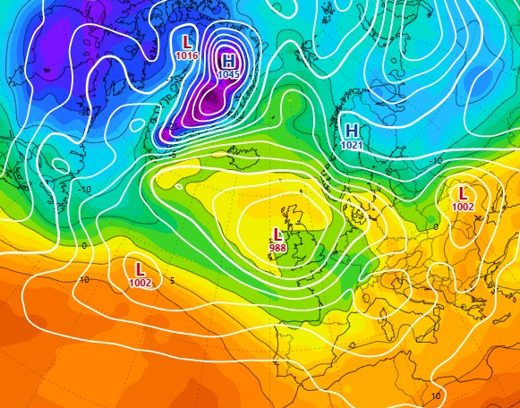
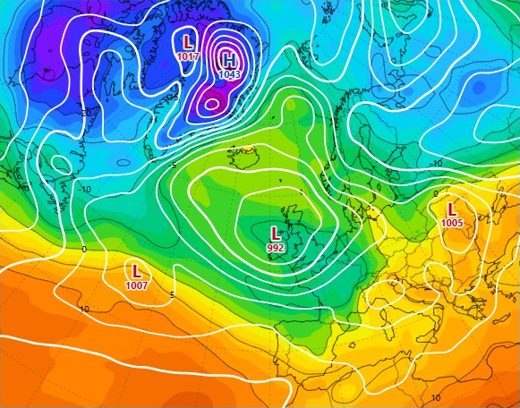
A real model, on your own computer.
No prerecorded animations: every run is computed live, in your browser.
1The starting map
A real analysis of the atmosphere: NOAA GFS for recent days, NOAA's NCEP reanalysis and Copernicus ERA5 for past situations.
2The model
Our own simplified weather model that computes the atmosphere in layers, on your computer's graphics card.
3Your change
Whatever you shape or move, the model first balances, so that wind and pressure fit together.
4Ten days ahead
Press play and follow what happens, hour by hour, next to the original.
How good is the model? On 16 winter days (December 2025 to February 2026), Model Lab still follows the 500 hPa weather pattern over Europe and the Atlantic well after 3 days (ACC 0.89, GFS 0.99) and reasonably after 5 days (0.72, GFS 0.92). An ACC of 1 is perfect; below 0.6 a forecast is no longer useful. How we measure this.
Model Lab is made for experimenting and learning, not for forecasting. It comes from Meteoproof, which compares the real weather models with observations every day. For that, see the front page.
Photos: 1978 Koen Suyk / Anefo, Nationaal Archief (CC0) · 2010 John Brightley, geograph.org.uk (CC BY-SA 2.0) · 2012 IngevGelder (CC BY-SA 3.0 NL) · 2018 Mark Anderson, geograph.org.uk (CC BY-SA 2.0)
What if it had gone differently?
Open Model LabFree. No account, nothing to install.
Your browser cannot run the model (no WebGPU). Open this page on a computer with a recent Chrome or Edge.
Model Lab is still in beta. Something not working, or an idea? Let us know at .